WritingA1
4.15 lesson1
语言提高–剑桥真题后面的作文sample
考试规格
Writing –1H
TASK1–20mins (150words)
TASK2–40mins(250words)
18年4月—-字数不重要,考官有权认为字数太少不足以论证充分
Task1 分类:
数据图/图表类
动态图 时间点>=2个 line graph, bar chart, pie chart,table表格
静态图 时间点=1or0个 bar chart, pie chart,table表格
mixed
非数据图
- diagrams流程图+maps 地图 (考试频率低)
Ø 时间点—区分动态图/静态 + 时态判断(考试时间为标准 past/present[题目没有时间点]/future)
评分标准4项: band-6 band-7–>Error Free

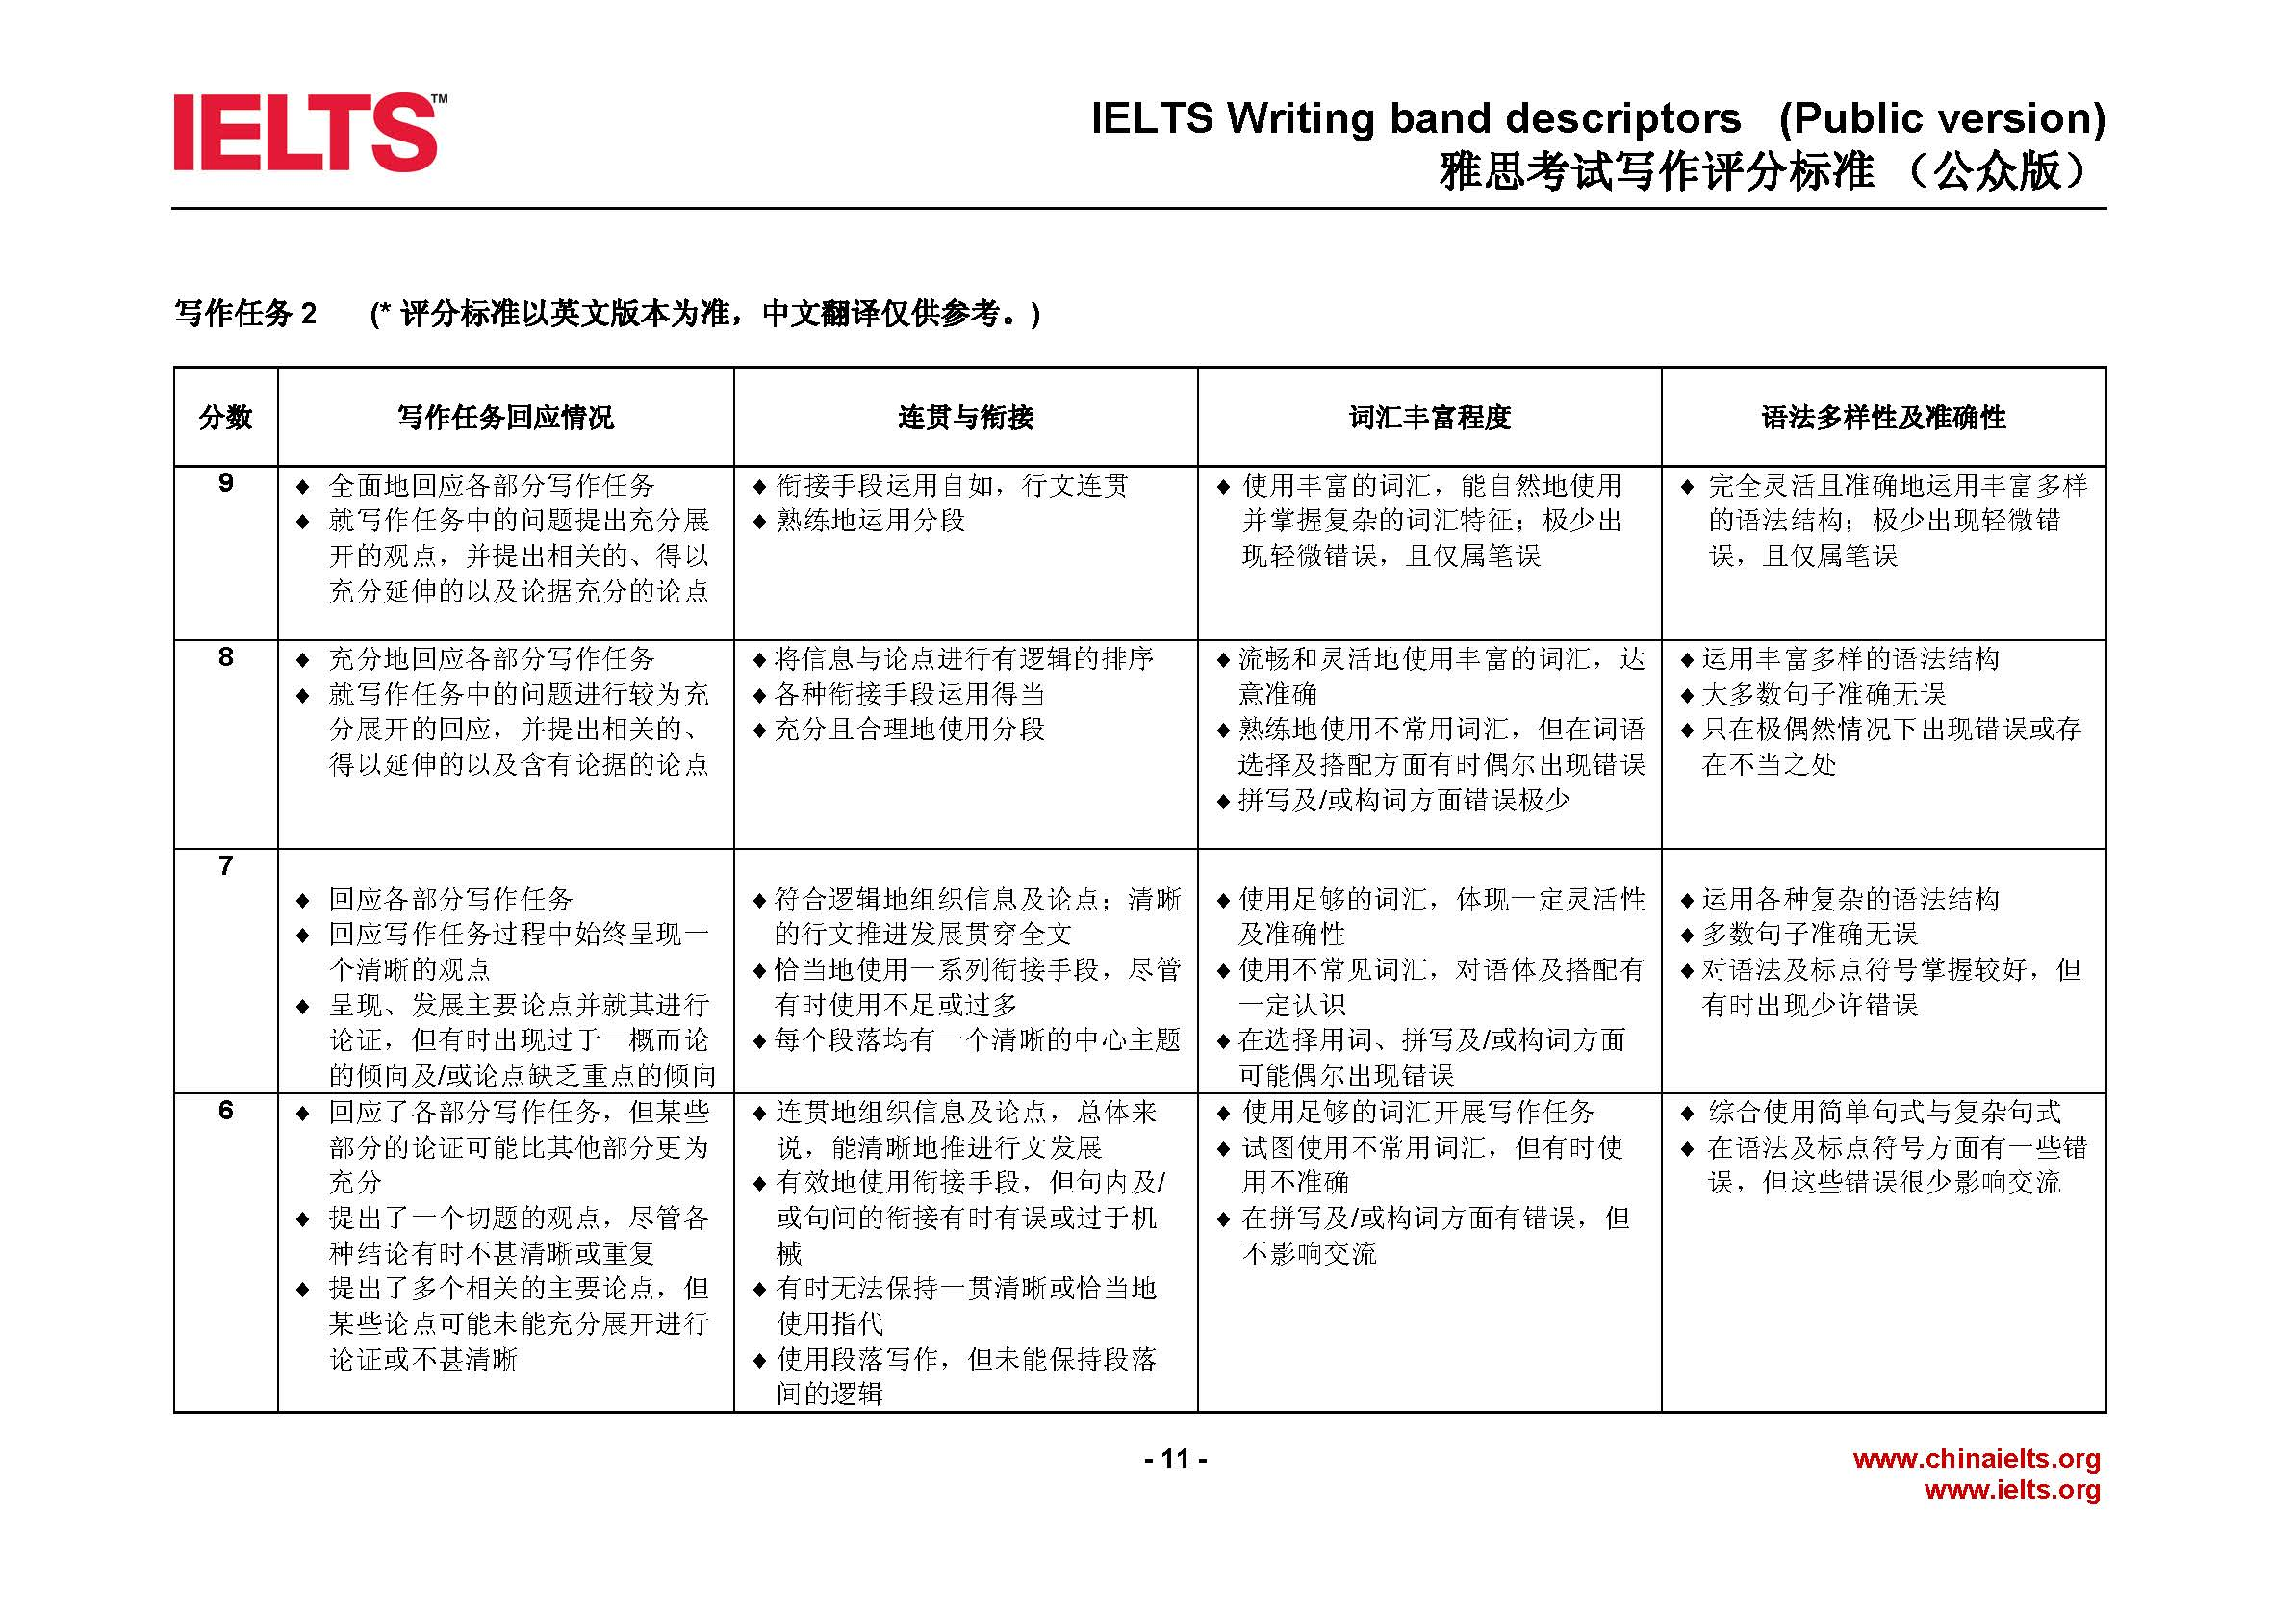

小作文
1. Grammatical range & accuracy:
simple + complex
Some errors (grammar+punctuation) BUT not reduce communication
2. Lexical resources 词汇:
Some errors BUT not reduce communication
高级词汇 less common:
- [C1/C2] [CEFR语言水平等级A1 A2 B1 B2 C1 C2]–> https://dictionary.cambridge.org
Handy -C2 convenient-B1
Face-A1 面子C2
[Spelling/ collocation]–>Longman/ word choice https://www.ldoceonline.com
[context语境]–>https://www.collinsdictionary.com
Quality of life✅ life quality❌
3. Task achievement
summary/overview概述段
Select/report key features
Comparisons
Coherence连贯 & cohesion衔接
arrange your information coherently
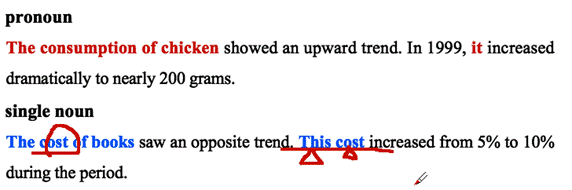
Cohesive devices[Linking words/ nouns-this/these+N./ pronouns-it/this]

4. Linking words:
_________****. However, __________. adv.
_________****, while ________ .conj.
对比关系(不同)
But, however, on the other hand, in contrast, by contrast –adv.
but, while, whereas –conj.
相似关系
Similarly, also
承接关系(时间先后)
Then, after that, following this, subsequently–adv.
Before, after–conj.
让步关系
Although, though, while
图表作文
段落结构 4段:
Introduction
- 题目信息paraphrase【常见替换词+概括性思维改写】=> 理解题目
Overview
- 1sentence 位置灵活 第二段or最后一段
Body paragraphs
- 2段
1. Introduction:
题目信息paraphrase
概括性思维改写 –how,why,what等疑问词
常见替换词:
Graph = line graph 线图
Table = diagram表格
Chart =bar chart柱图 = pie chart 饼
Below 删掉
Show = give information about= compare = describe
描述对象:
The consumption of … = the amount of …consumed
The emission of …= the amount of …emitted
The production of …=the amount of …produced
The quantity of =the amount of … +UC
The number of… = +C
The percentage of… = the proportion of … 比例
……..
Between … and … = from … to … = over a period of … years
In 2000 = in the year of 2000
题干信息=图片信息:
eg. in four countries =in A, B, C and D
Four kinds of transport = road, water, rail and pipeline
实例:
C7p53
The line graph describes the amount of beef, lamb, chicken and fish consumed in a European country from 1979 to 2004.
……. how fish and different kinds of meat was consumed ……..

⬇️
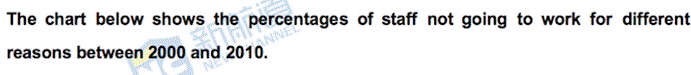
The bar chart describes the proportion of staff not going to work for various reasons in 2000, 2005 and 2010.
The bar chart describes the reasons why staff did not go to work between 2000 and 2010.
C11p30:
The pie charts describe how water is used in six areas of the world.
The pie charts describe the proportion of water used for domestic, industrial and agricultural purposes ……
C15p93
…..the proportion of graduates who do full-time work/ unemployed/ ….
illustrate
作业:
笔记复习
C11p77,C8p101, C6p52
the presented line graph depicts the temporal evolution of how much goods transported by road,water,rail or pipeline from 1974 to 2002.
折线图中展现了英国商品运输的四种方式,陆运,水运,火车,管道,在1974年到2002年运输货量的变化
the presented diagram illustrates the number of travelled distance per capita by eight different modes between1985 and 2000.in these fifteen years travelled distance are totally increased but in some modes are decreased.
解答:
Distance traveled by …..(taking taxi/ walking)
C11p77
The line graph describes changes in average amount of carbon dioxide[<=emitted] //how carbon dioxide was emitted in four countries(….) from 1967 to 2007.
C8p101
by country, by household, by different modes of transport
按照根据
The line graph describes how goods transported //the amounts of goods transported by (被动语态)road, water, rail and pipeline in the UK from 1974 to 2002.
C6p52
*The table describes how people traveled //how modes of travel changed* *(=changes in ….**)in …. between .. and ..*