line graph technology adoption
折线图technology adoption
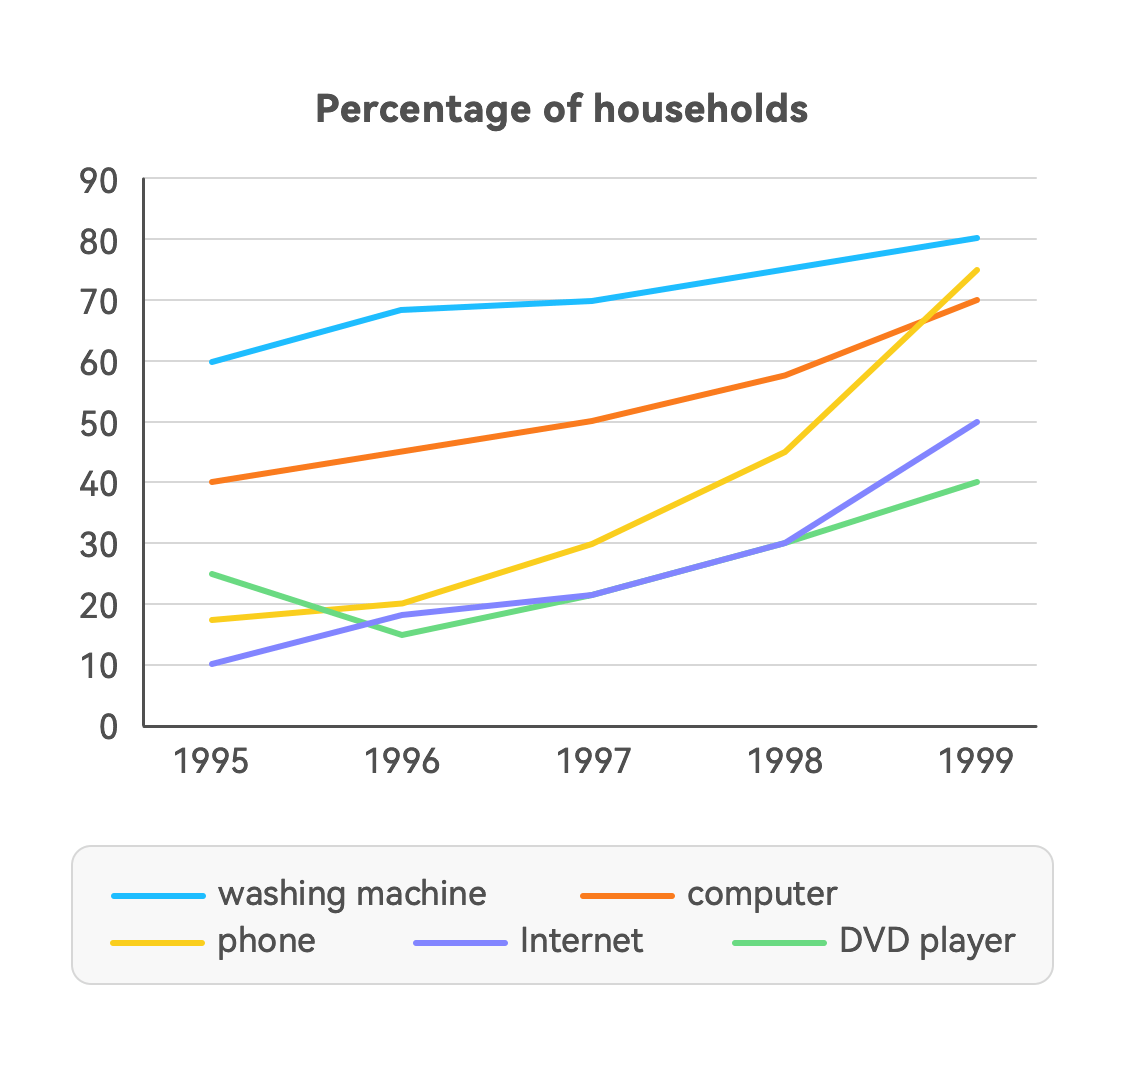
The graph below shows the percentage of households with different kinds of technology in the U.S. from 1995 to 1999. Summarize the information by selecting and reporting the main features, and make comparisons where relevant.
Write at least 150 words.
练习
This line graph shows that the percentage of five kinds of technology was used in houses from 1995 to 1999.
Looking through all the graph it illustrates that, in these five years, all the technology had an increased trend. It means people’s lives were better and life quality was more important in people’s daily lives.
However, some technology did not increase obviously, like DVD players just increased 15 per cent and in 1995 it had a sharp decrease. Maybe it was crowded out by the internet and computers were being used. In the next four years it increased smoothly. In the end, it was just 40 percent, not until 50 per cent.
The internet and computers all increased about 30 per cent and the trend was smooth. They had so many similar features, maybe because the computer uses advantage to use the internet. The phone increased rapidly. At the end of 1995 it beat the Internet and DVD player and in the middle of 1998 it became more then the computer became the second most households. The biggest percentage of households is the washing machine. It rises from 60 percent to 80 percent. In my opinion, it is a necessary equipment in the house and it’s more useful, so it’s the no. 1 needed in the house.
All in all, people’s lives become better and technology develops fast so that the internet, phone, and computer can increase so obviously.
AI
The provided graph illustrates the changing percentages of households in the United States possessing various types of technology from 1995 to 1999. A comprehensive analysis reveals several noteworthy trends.
Firstly, it is evident that there was a consistent increase in the adoption of technology during this period. The most dramatic surge was observed in the usage of washing machines, which rose from 60% to 80%. This indicates the importance of this household appliance.
Secondly, the utilization of the internet and computers also experienced substantial growth, with both technologies increasing by approximately 30%. The steady nature of their growth suggests the growing role of these tools in daily life, possibly due to their mutual compatibility.
Thirdly, the telephone witnessed rapid adoption, overtaking the internet and DVD players by the end of 1995 and surpassing computers in mid-1998, becoming the second most common household technology.
On the other hand, DVD players exhibited a more moderate increase, with a 15% rise. The initial decrease in 1995 may be attributed to competition from the internet and computers.
In conclusion, this period saw a considerable surge in technology adoption, with washing machines, the internet, computers, and telephones being prominent choices among U.S. households. DVD players, though growing, had a more modest increase in comparison.